Decision system · Flagship case
Profitability & Workforce Efficiency
A finance-led analytics system that connects time, revenue, cost and utilization into one operating view.
Inside the reports
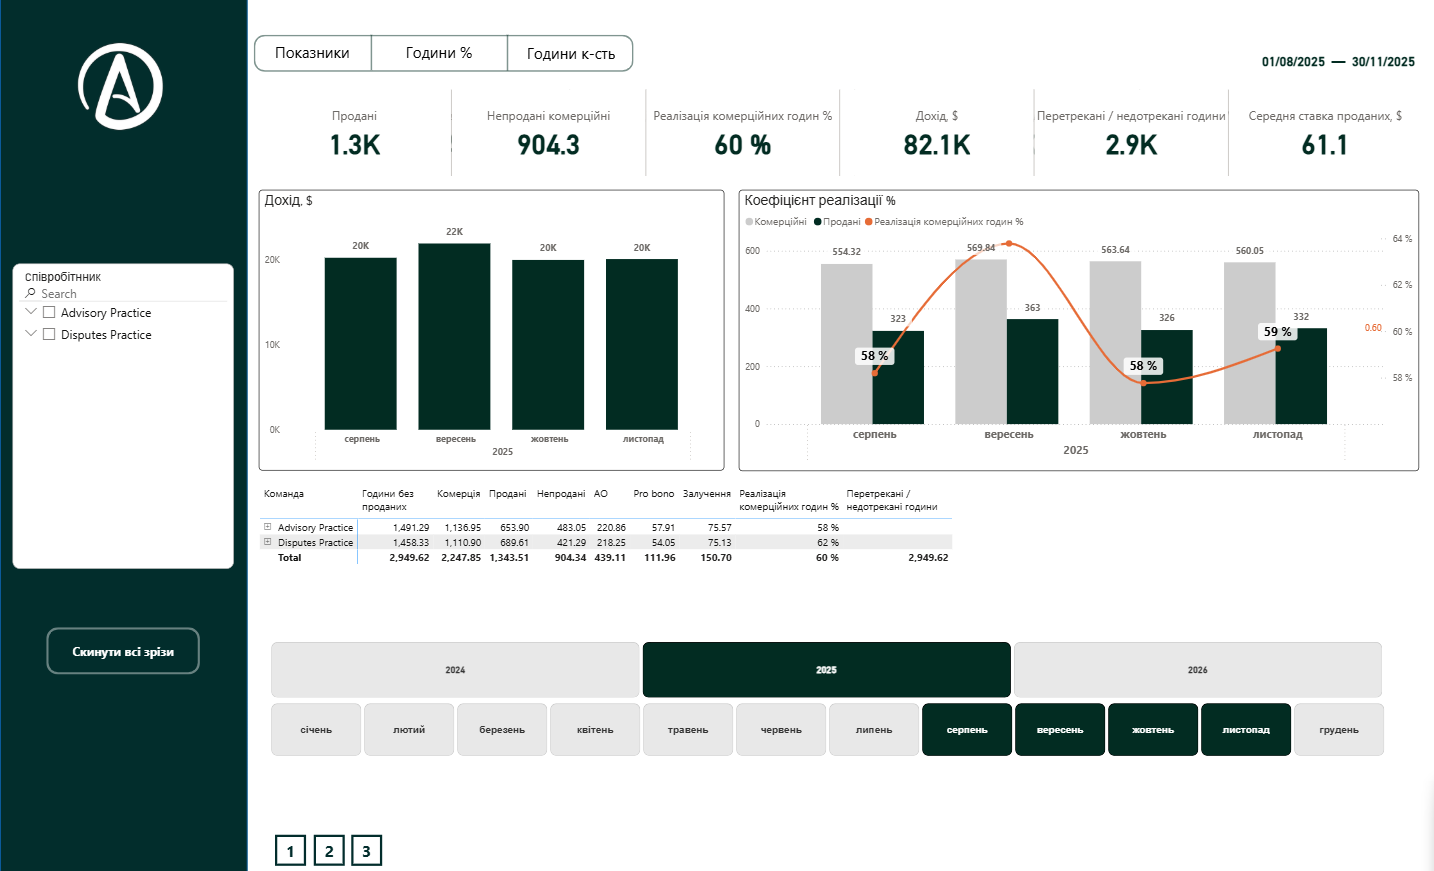
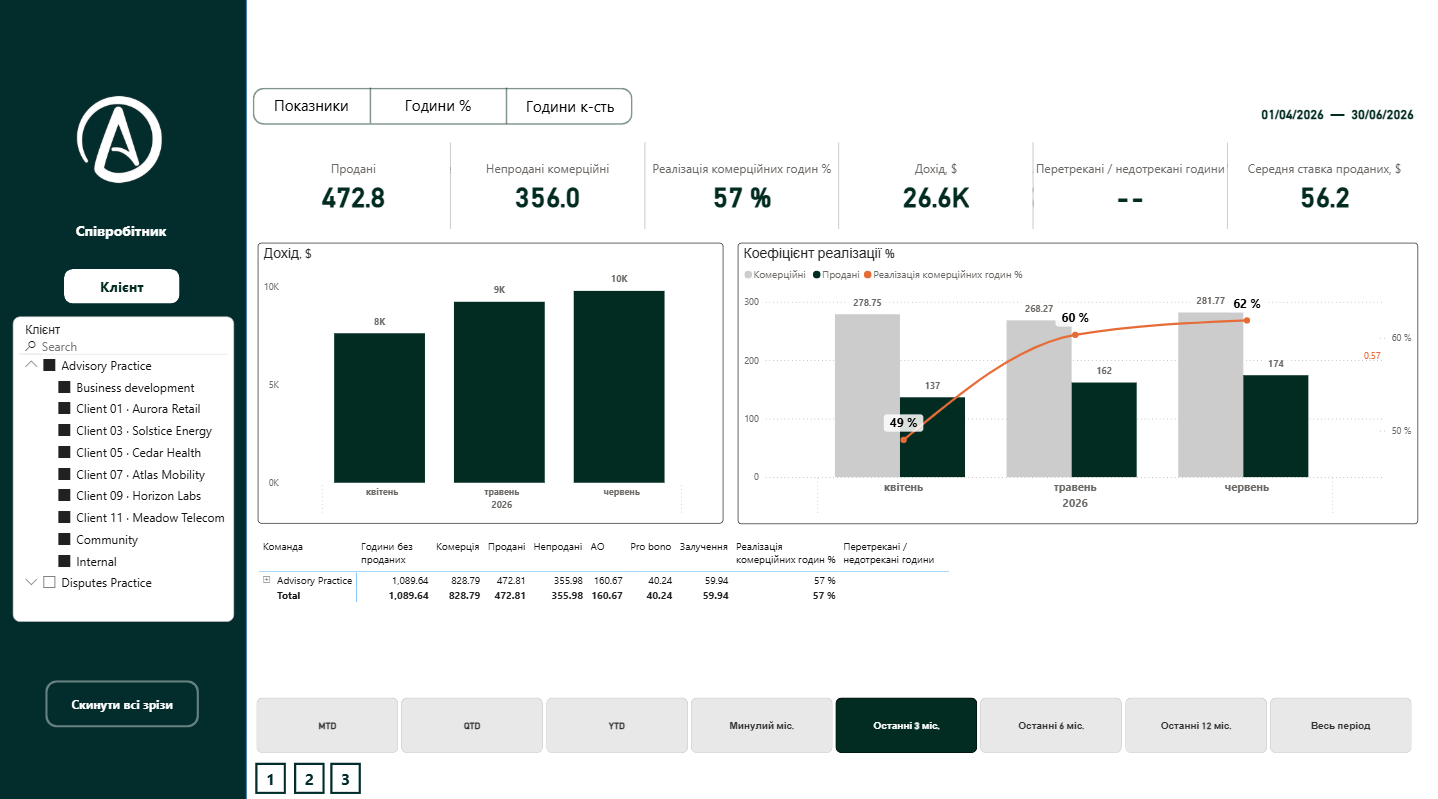
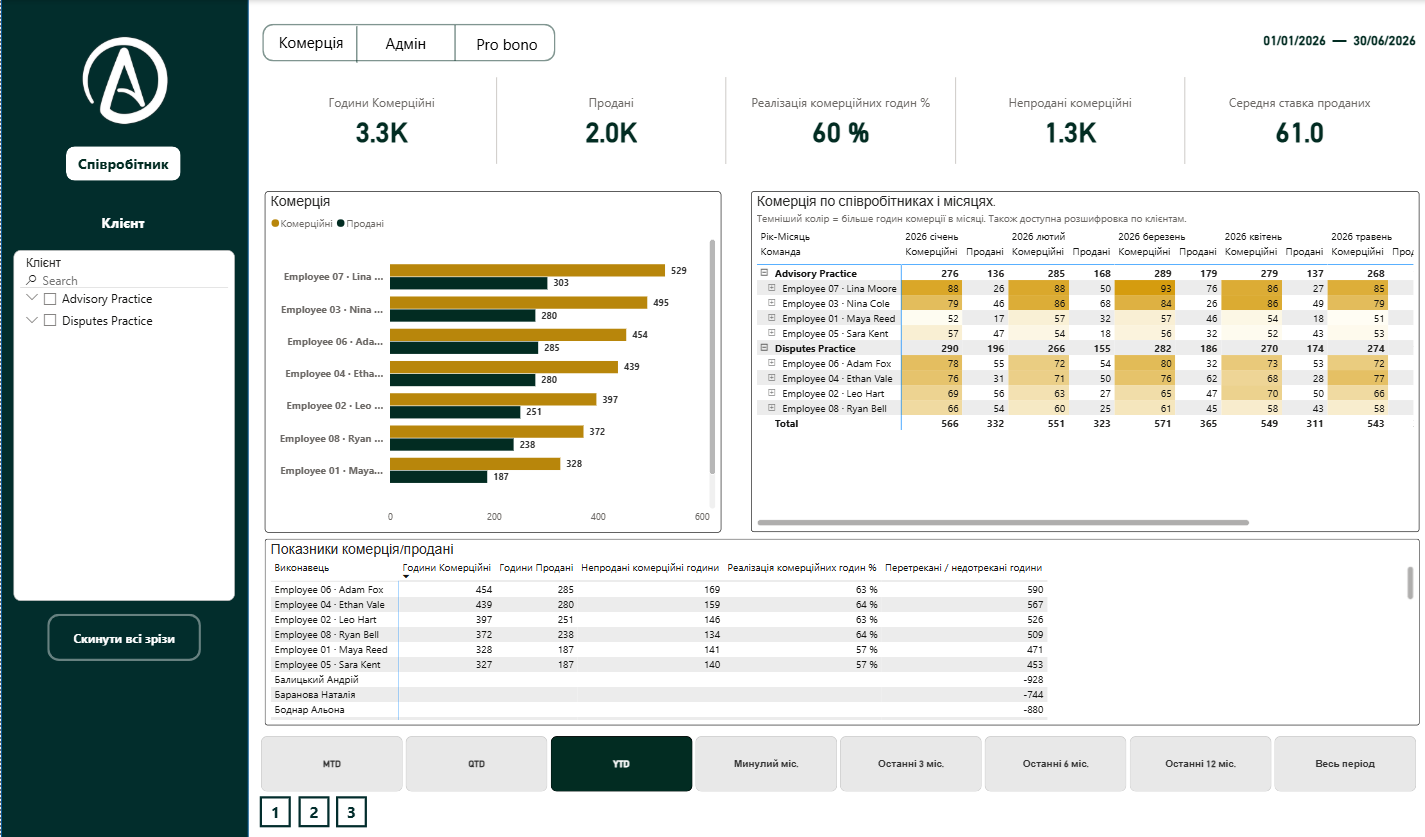
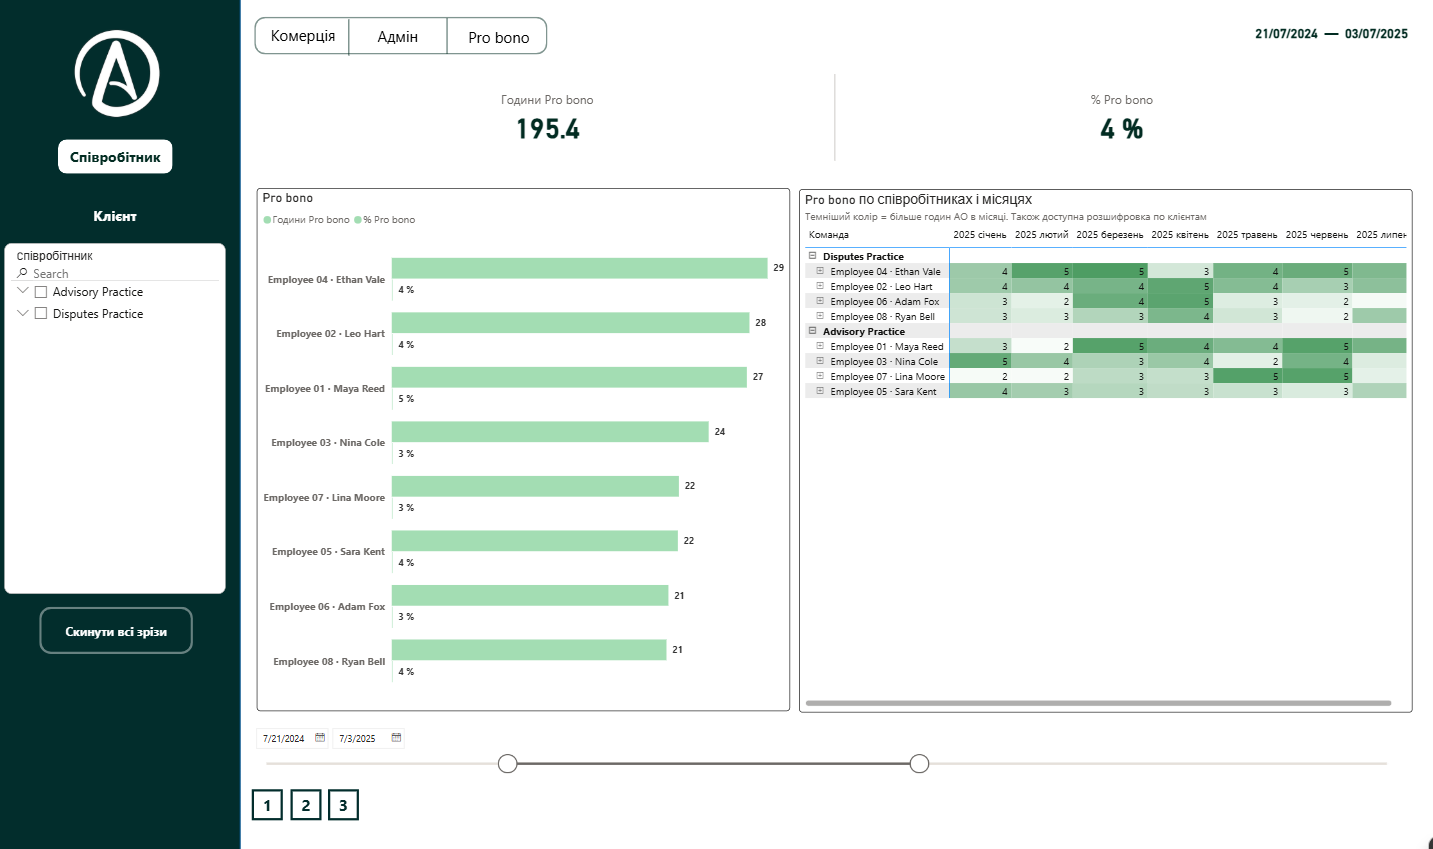
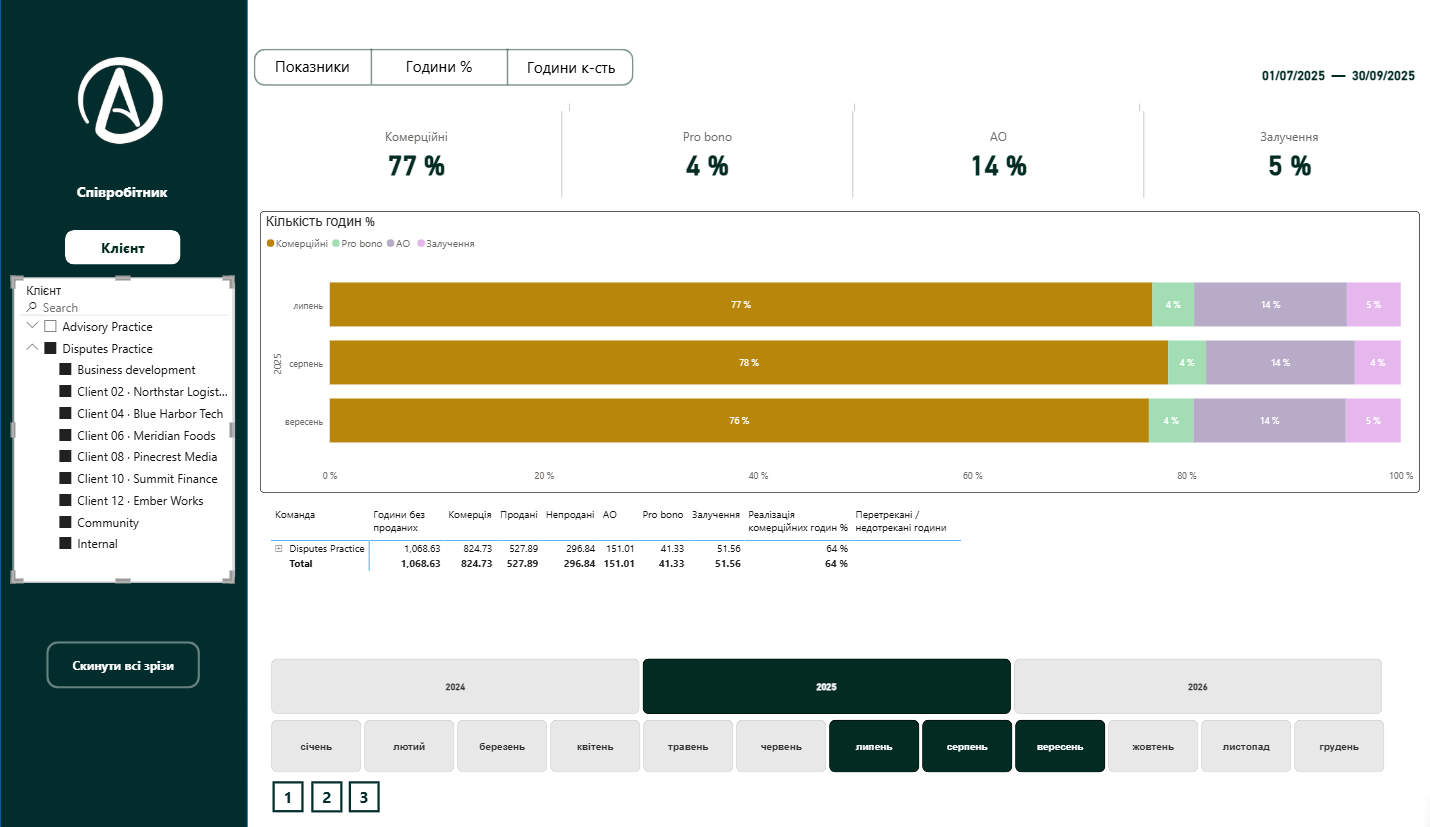
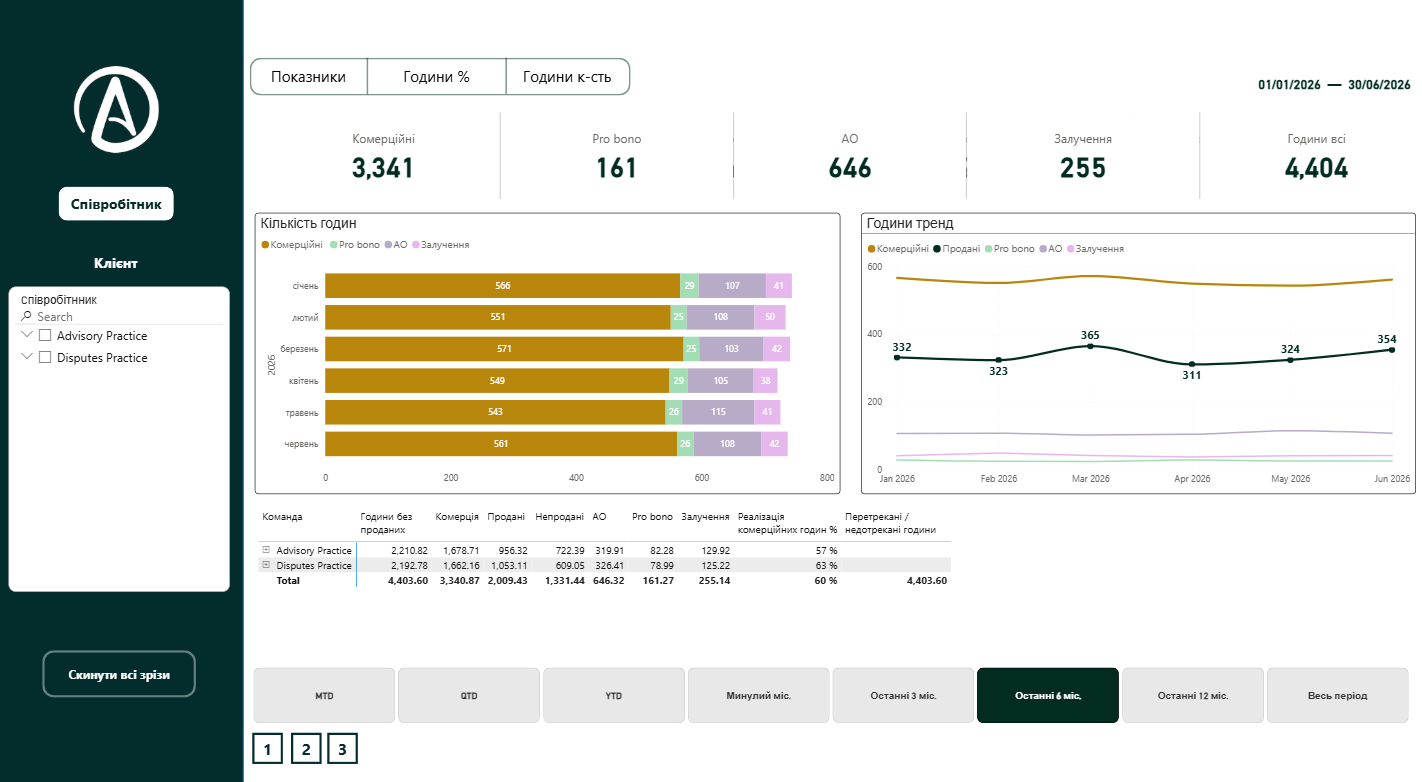
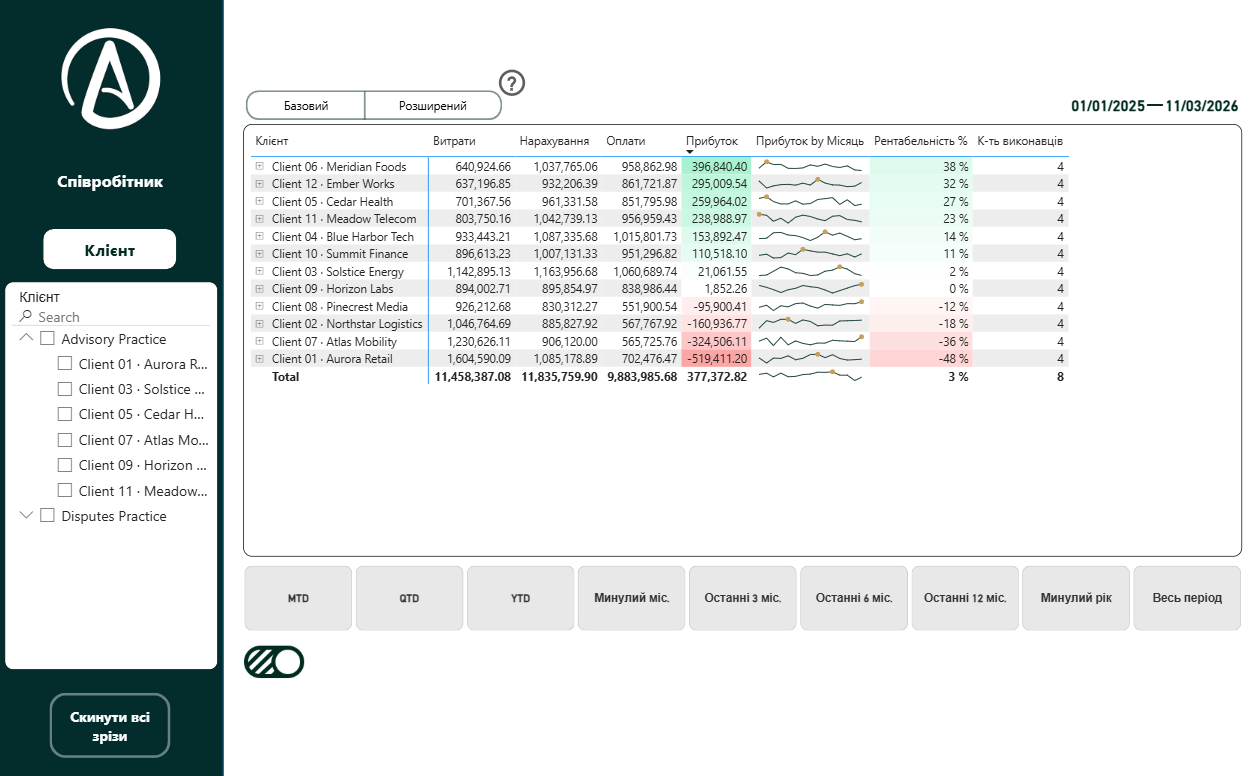
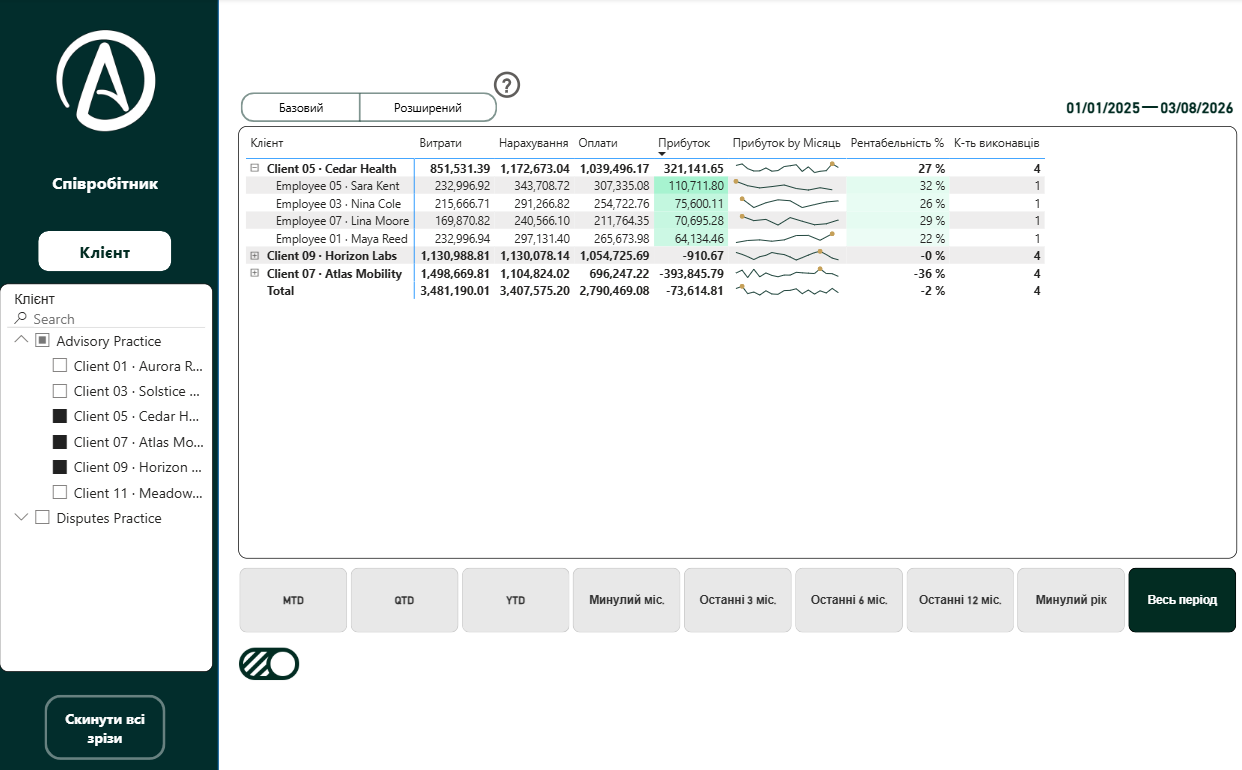
Ten pages, each answering one management question
Pick a page
Mechanics
The behaviour behind every page
- Dual lens
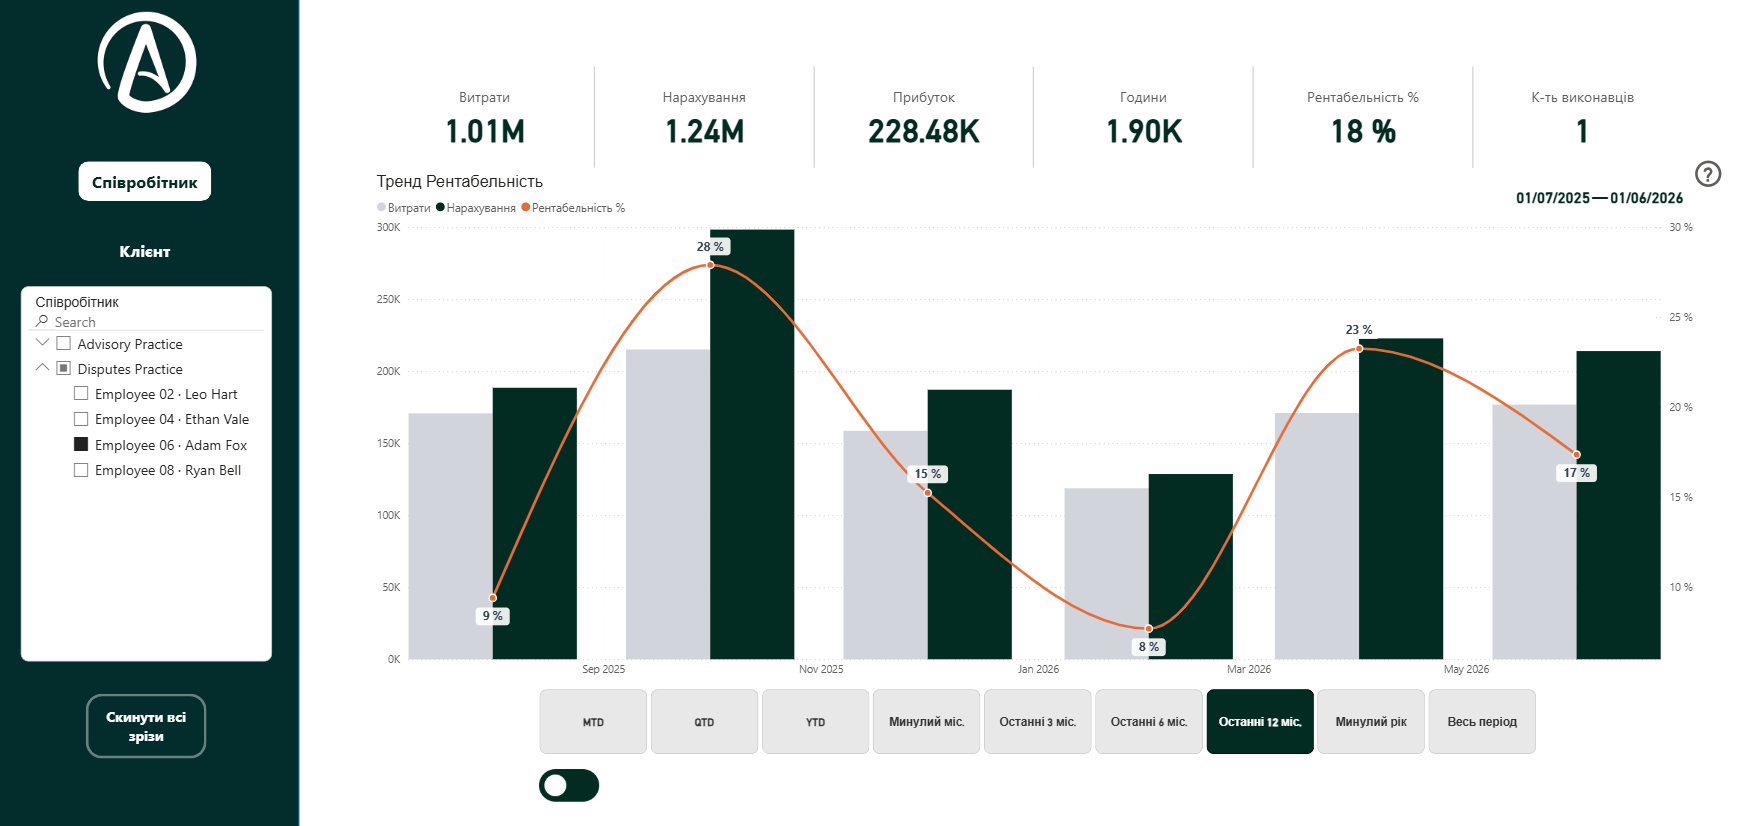
Every page switches between the client and the employee dimension without duplicating a single measure.
- Period presets
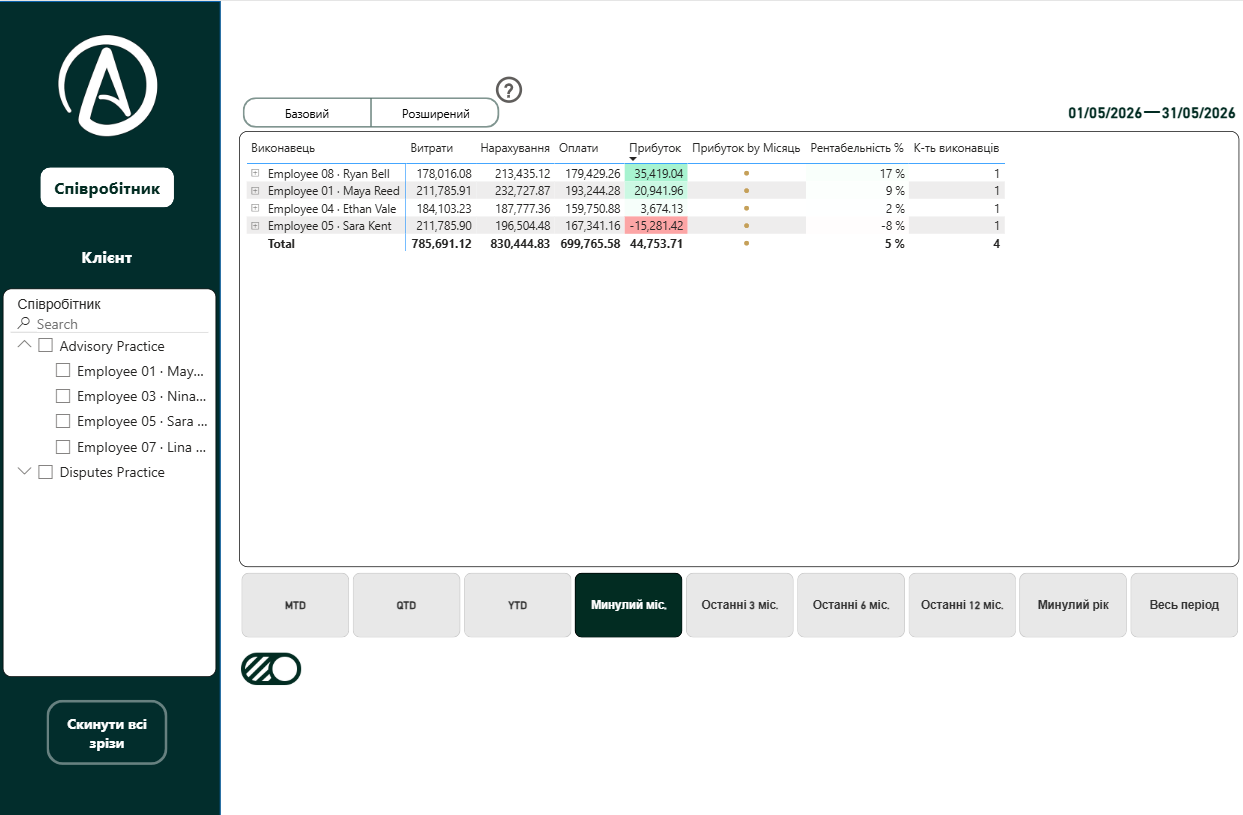
MTD, QTD, YTD, last 3 / 6 / 12 months or a free range — one click, and every visual follows.
- Drill-down in place
Practice → client → performer expands inside the same table, so context is never lost.
- Formatting that reads
Profit and margin are coloured against zero, so loss-making work is seen before it is read.
- Trend inside the row
Sparklines carry twelve months of profit history in a single line of the table.
What it changed
The same month, with and without the system
Nothing about the business changed. What changed is how long it takes to see it, and how much of it you can trust.
| What changes | Without itSpreadsheets assembled by hand | With the systemOne model, refreshed on demand |
|---|---|---|
| Monthly reporting cycle | Without it10 person-hours of manual assembly across 2–3 people, pulled off client work | With the system10 minutes and one owner — 120 hours a year back to billable work |
| Client profitability | Without itEstimated after the invoices are out, if anyone gets to it | With the systemCost, revenue and margin for every client, ranked before the next quote |
| Where the team’s time goes | Without itHours are recorded; how many of them turned into revenue is not | With the systemSold, unsold and non-billable hours per person, month by month |
| One question deeper | Without itAnother export, another file, another evening | With the systemPractice → client → performer opens inside the same table |
| Agreeing on the numbers | Without itFinance and delivery arrive at the meeting with different figures | With the systemUtilization and profitability read the same measures — one version of the truth |
| Next month | Without itThe whole assembly starts again from zero | With the systemRefresh, and the report is already built |